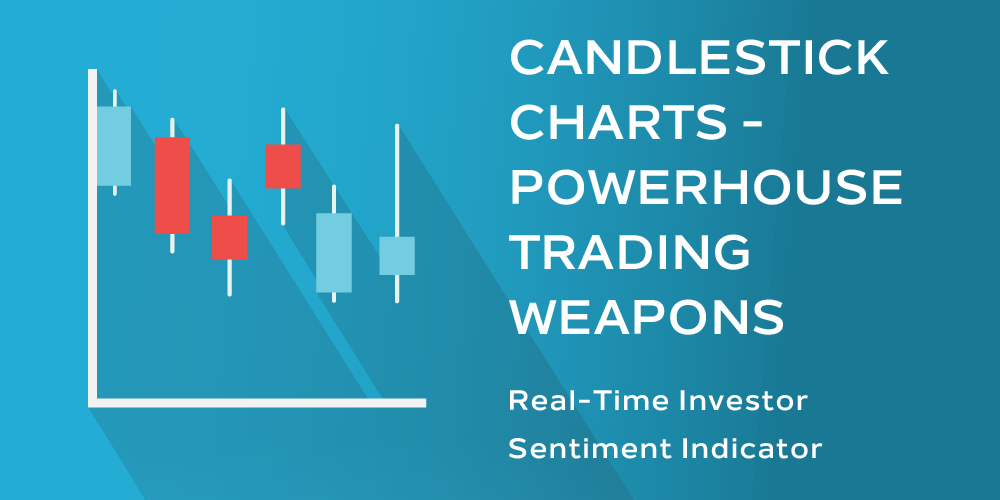
The candlestick chart provides traders and investors quick and easy insight into price action and market sentiment. Most traders consider candlestick charts to be much easier to interpret than traditional bar charts.
Candlesticks measure price for a specified time period. A bullish candle is often colored green while a bearish candle is often colored red. These differences in color allow traders to easily see if price advanced or declined during a specific time period.
For a given price period, candlesticks show traders the opening price, the closing price, the high of the period and the low of the period.
What Types of Candles Are There?
Candles can be grouped into two basic categories:
1. Bullish/Bearish Candles
A bullish or bearish candle will have a full body with little to no wick. In a bearish candle, for example:
Price will open at or very close to the top of the candle, then decline, and finally, close at or very close to the bottom of the candle.
Bullish or bearish candles can have a wick at the top, bottom, or both.
2. Indecision Candles
Indecision candles demonstrate indecision on the part of traders. These candles have more wick than body and price may have traveled significantly from the high, the low, or both. An indecision candle will display price closing at or near the opening price for that period after failing to move convincingly up or down. These candles show the tug of war between buyers and sellers. An indecision candle can be part of price consolidation or can be a sign of market reversal.
So is it price consolidation?

A spinning top candle shows the battle between bulls and bears. While price may be volatile and cover significant ground, the opening and closing prices of this pattern indicate equal buying and selling pressure. A spinning top will have a small body with larger wicks. This candle may be seen during consolidation before resumption of a trend.

The doji candle is often a short candle, in which the opening and closing price are nearly identical. This candle has a very small body and looks like a cross. This candle also may be seen during a period of consolidation before the trend resumes.
Or is it Market Reversal?
While indecision candles demonstrate an equality between buyers and sellers, there are a few indecision candles that can potentially be indicative of an impending market reversal.
Four candles that may indicate an impending market reversal are the inverted hammer, hanging man, dragonfly doji and the gravestone doji.

The inverted hammer has a small body with little to no wick on the bottom and has a long wick on the top. This candle demonstrates the failure of buyers to sustain higher prices within the specified time period.
The shooting star candle is identical to the inverted hammer but while an inverted hammer occurs in a downtrend, the shooting star occurs in an uptrend and thus has different implications.
IN ACTION – The inverted hammer is formed when the bulls attempt to take price higher in a downtrend but fail as their efforts are met with willing sellers who take price back down to or near the candle’s opening price.
WHAT TO DO – The inverted hammer means the bulls are showing some signs life. A bullish reversal could potentially be in store so it may be wise to cover shorts or scale back.

The hanging man candle features a very small body with little to no wick on its top and a long wick on the bottom. The hanging man shows price opening and closing near the high of the specified period. The wick on the bottom of the candle should be at least twice the size of the candle body. A hammer candle is identical to the hanging man, but these candlestick types have different implications based on where they occur within a trend.
IN ACTION – The hanging man is seen when sellers try to overpower buyers in an uptrend. As price is driven lower, the bulls step in to buy -driving price back to or near the high of the candle.
WHAT TO DO – The hanging man may show the bears gaining some traction and could be indicative of a potential reversal. This may be a time to cover or cut back on longs, or even go short if the pattern is confirmed by a subsequent bearish candle.

A dragonfly doji, like the hanging man, shows price opening and closing at or near the top of the candle. This candle will have a smaller body than the hanging man as the open and close are nearly identical.
IN ACTION – Price declines on bearish pressure that is then met by significant buying pressure. The bulls overpower the bears taking prices higher again.
WHAT TO DO – A signal to go long may be generated if the dragonfly doji occurs within a downtrend and is followed by a higher candle.

The gravestone doji looks like the opposite of the dragonfly doji. This candle shows price opening and closing at or near the bottom of the period. The gravestone doji has a smaller body than an inverted hammer.
IN ACTION – Price rises as the bulls buy but is eventually met with significant bearish resistance. The bears begin selling and overpowering the bulls, thus driving prices back down.
WHAT TO DO – If this gravestone doji is seen within an uptrend, it may be time to consider covering long positions as a reversal may be at hand.
Candlestick charts provide traders a unique perspective on markets that other chart types do not. Candlesticks provide traders a simple visual representation of price action that can potentially provide clues about near-term market direction.
While individual candles can be very powerful, candles become even more powerful when combined with other candles. For example, a potential reversal candle should be confirmed by a decision candle. A combination of candles may form other technical patterns such as a head and shoulders pattern that may provide potential trade signals.
Candlestick charts give a real-time assessment of investor sentiment. Investors are either bullish, bearish or undecided. Candles can be useful for both trade entry and trade exit and can be especially significant when combined with other forms of technical analysis.


